
Quick Answer #
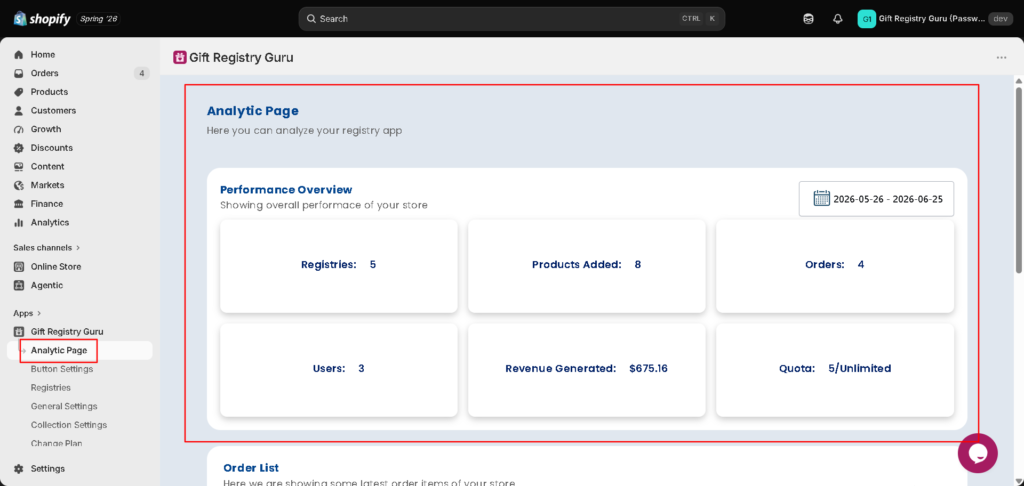
To see how your gift registry is performing, go to Gift Registry Guru Dashboard > Analytic Page. You will find a performance overview with six key metrics—registries, products added, orders, users, revenue generated, and quota. Below that, the Order List shows your most recent registry-driven sales. Use the date range picker to filter all data by any time period you choose.
Running a Shopify store is busy enough. That is why Gift Registry Guru puts all your most important registry numbers in one place — the Analytic Page. Think of it as your registry dashboard. In just a few seconds, you can see how many registries customers have created, which products are getting added, how much revenue the feature is generating, and who is buying.
In addition, the analytic page gives you an order list so you can keep an eye on the latest purchases made through your registries. As a result, you always know what is happening in your store—without having to dig through Shopify reports.
How to Open the Analytic Page #
First, make sure you are logged into your Shopify admin. Then follow these steps.
- Open the Gift Registry Guru app from the Apps section in your Shopify Admin left sidebar.
- Click “Analytic Page” in the Gift Registry Guru left-hand menu.
- The Analytic Page opens immediately. It shows your performance overview and order list for the current date range.
Understanding the Performance Overview #
The Performance Overview section sits at the top of the analytic page. It shows six metric cards that give you a snapshot of your store’s registry activity. Each card updates automatically when you change the date range.
Here is what each metric means and why it matters to your store.
Registries #
This number shows the total gift registries your customers have created within the selected date range. It is a great way to measure how actively shoppers are using the registry feature in your store.
For example, if you ran a wedding season promotion last month, you can filter to that period and see exactly how many new registries it generated.
Products Added #
This metric shows the total number of products that registry owners have added to their lists. A higher Products Added number is a strong signal. It means your customers are engaged and actively building their wishlists from your catalog.
In addition, it can help you identify which event seasons drive the most wishlist activity in your store.
Orders #
The Orders metric shows the total number of purchases gifters have made through your registries. Think of it as your registry conversion number — how many times someone actually bought a gift from a customer’s list.
As a result, tracking this alongside Products Added tells you how well your registry items are converting from wishlists into real sales.
Users #
Users show the total number of unique customers who have created a registry in your store. This is different from registries, because one customer can create more than one registry.
For example, a customer might create a wedding registry and a birthday registry. In that case, they count as one user but two registries.
Revenue Generated #
This is the metric most merchants check first — and for good reason. Revenue Generated shows the total money your store has earned from registry-driven purchases within the selected period.
It is the clearest measure of the value Gift Registry Guru adds to your Shopify store. Furthermore, you can filter by any date range to see how revenue from registries is trending over time.
Quota #
Quota shows how many registries your current plan allows. For example, 5/Unlimited means 5 registries have been created and your plan has no cap.
However, if you are on a plan with a registry limit, this number helps you track how close you are to that cap. If you are approaching your limit, you can upgrade your plan directly from Gift Registry Guru to keep things running smoothly.
Tip: If your quota is approaching its limit, go to Gift Registry Guru > Change Plan to upgrade. As a result, your customers can keep creating registries without interruption.
How to Filter by Date Range # #
Every metric on the analytics page is tied to a date range. By default, Gift Registry Guru shows data for the last 30 days. However, you can change this to any period you like.
- Locate the date range picker in the top right of the Performance Overview section.
- Click on it to open the calendar picker.
- Select your start date and end date.
- All six metric cards update automatically to reflect data from your chosen period.
Tip: Use the Date Range filter to compare different periods. For example, filter to December to see how your registries performed during the holiday season. Then compare it to the previous year to spot trends.
Understanding the Order List #
Below the Performance Overview, you will find the Order List. This table shows the most recent orders placed through your gift registries. It is a quick way to see who is buying and what they purchased—without leaving Gift Registry Guru.
Understanding the Order List Table #
| Column | Description |
|---|---|
| Order ID | The Shopify order ID for the purchase. For example, #1004. You can cross-reference this in Shopify Admin > Orders for full payment and fulfillment details. |
| Title | The name of the product the gifter purchased. |
| Image | A thumbnail image of the purchased product so you can identify it at a glance. |
| Price | The price the gifter paid for the product at the time of the order. |
| Quantity | The number of units the gifter ordered in this transaction. |
| Customer Name | The full name of the gifter who placed the order. |
| Customer Email | The email address of the gifter. Use this to follow up or resolve any order queries directly. |
Tip: Use the order ID to jump straight to the full order in Shopify Admin > Orders. From there, you can check shipping status, payment details, and fulfillment progress.
Note: The Order List on the Analytic Page shows your most recent orders only. For a full order history broken down by individual registry, go to Gift Registry Guru > Registries and open the Registry User Report Page for that customer.
Frequently Asked Questions #
#
Go to your Gift Registry Guru Dashboard in Shopify Admin. Next, click Analytic Page in the left-hand sidebar. The page opens straight away and shows your Performance Overview and latest Order List.
#
The Registries metric shows the total number of gift registries customers have created in your store within the selected date range. It gives you a quick picture of how much registry activity your store is generating.
#
Products Added shows the total number of products registry owners have added to their lists within the selected date range. A higher number means customers are actively building their wishlists from your catalog.
#
The Orders metric shows the total number of orders gifters have placed through your registries within the selected date range. It reflects how many times someone actually bought a gift from a customer’s registry list.
#
Revenue Generated shows the total money your store has earned from registry-driven purchases within the selected date range. It is the clearest measure of how much value the gift registry feature is adding to your Shopify store.
#
Users show the total number of unique customers who have created a registry in your store. Note that one customer can create more than one registry. As a result, your user count may be lower than your registries count.
#
A quota shows how many registries your current plan allows compared to how many have been created. For example, 5/Unlimited means 5 registries exist and your plan has no cap. If you are on a limited plan, this helps you track how close you are to your limit. Go to Change Plan to upgrade when needed.
#
Use the date range picker in the top right of the performance overview. First, click it to open the calendar. Then select your start and end date. As a result, all six metric cards update automatically to show data for your chosen period.
#
The Order List shows the most recent orders placed through your gift registries. Each row displays the order ID, product title, image, price, quantity, and the customer name and email of the gifter. For the full order history by registry, go to Gift Registry Guru > Registries.


